.svg)
The San Francisco multi-unit real estate market had a strong Q1 in 2020, with both transaction volumes and property values up. Our quarterly market report breaks down the market’s performance during the quarter, and offers a side-by-side comparison with the first quarter of 2019.
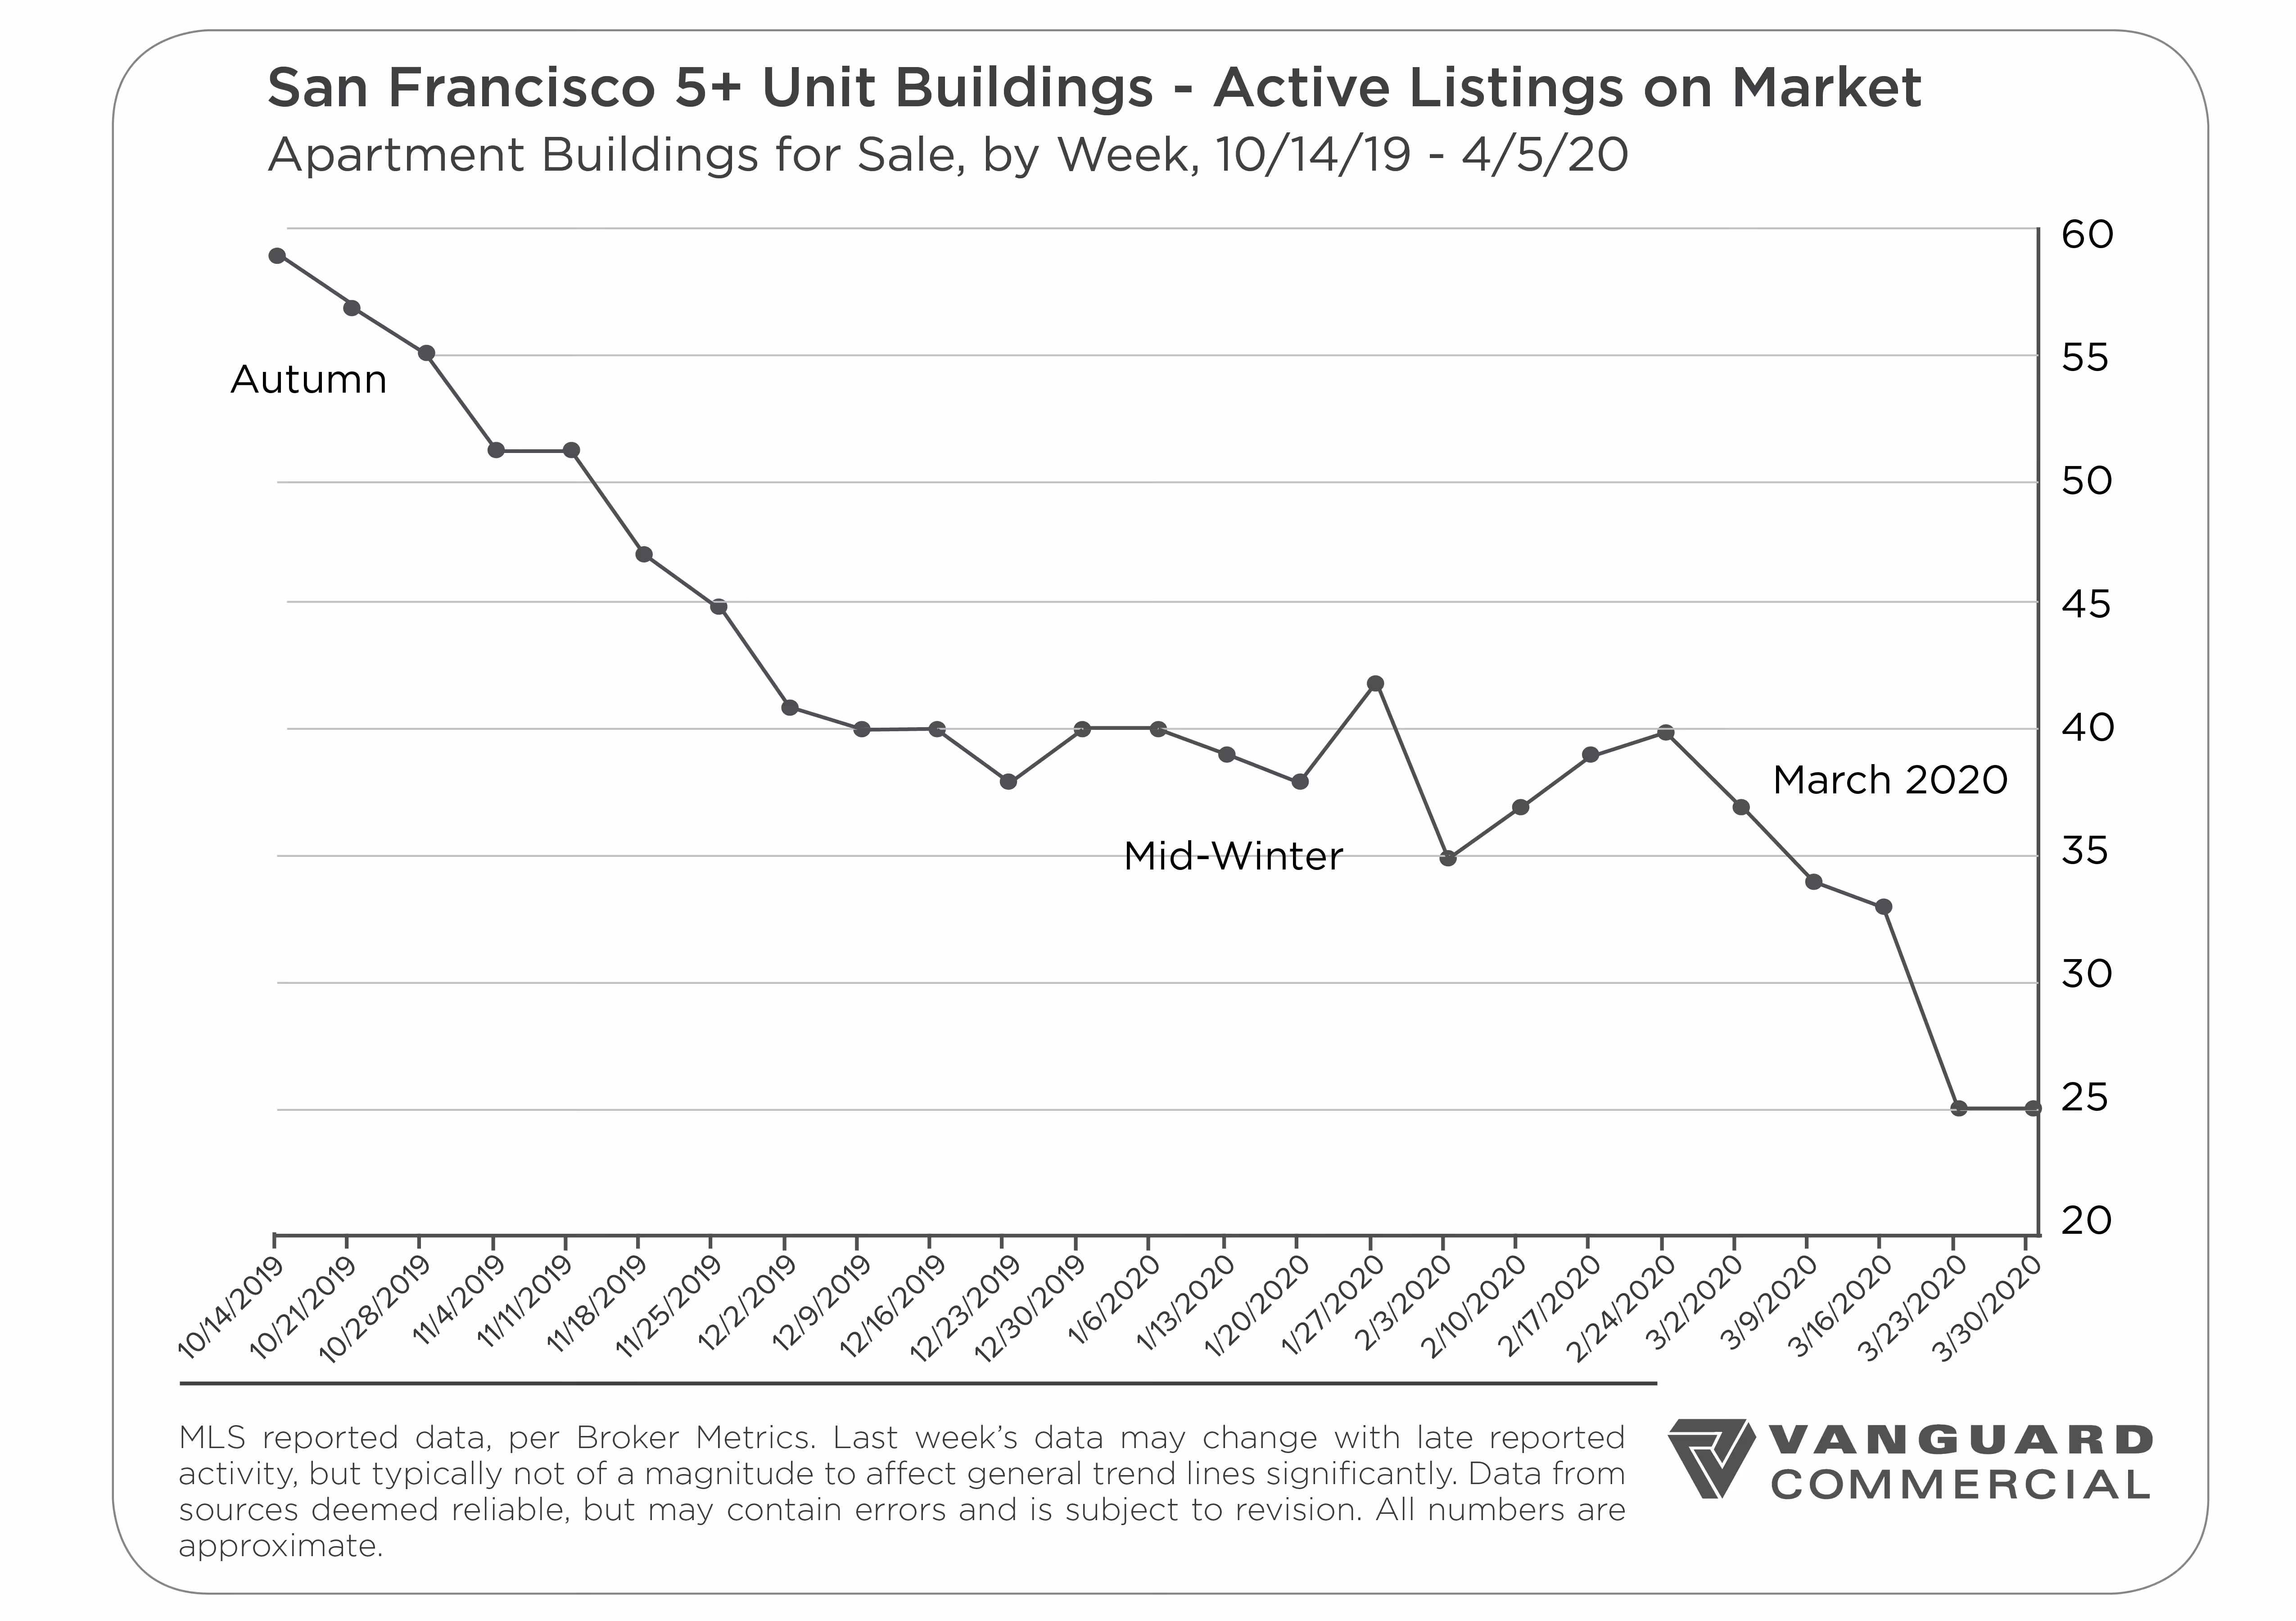
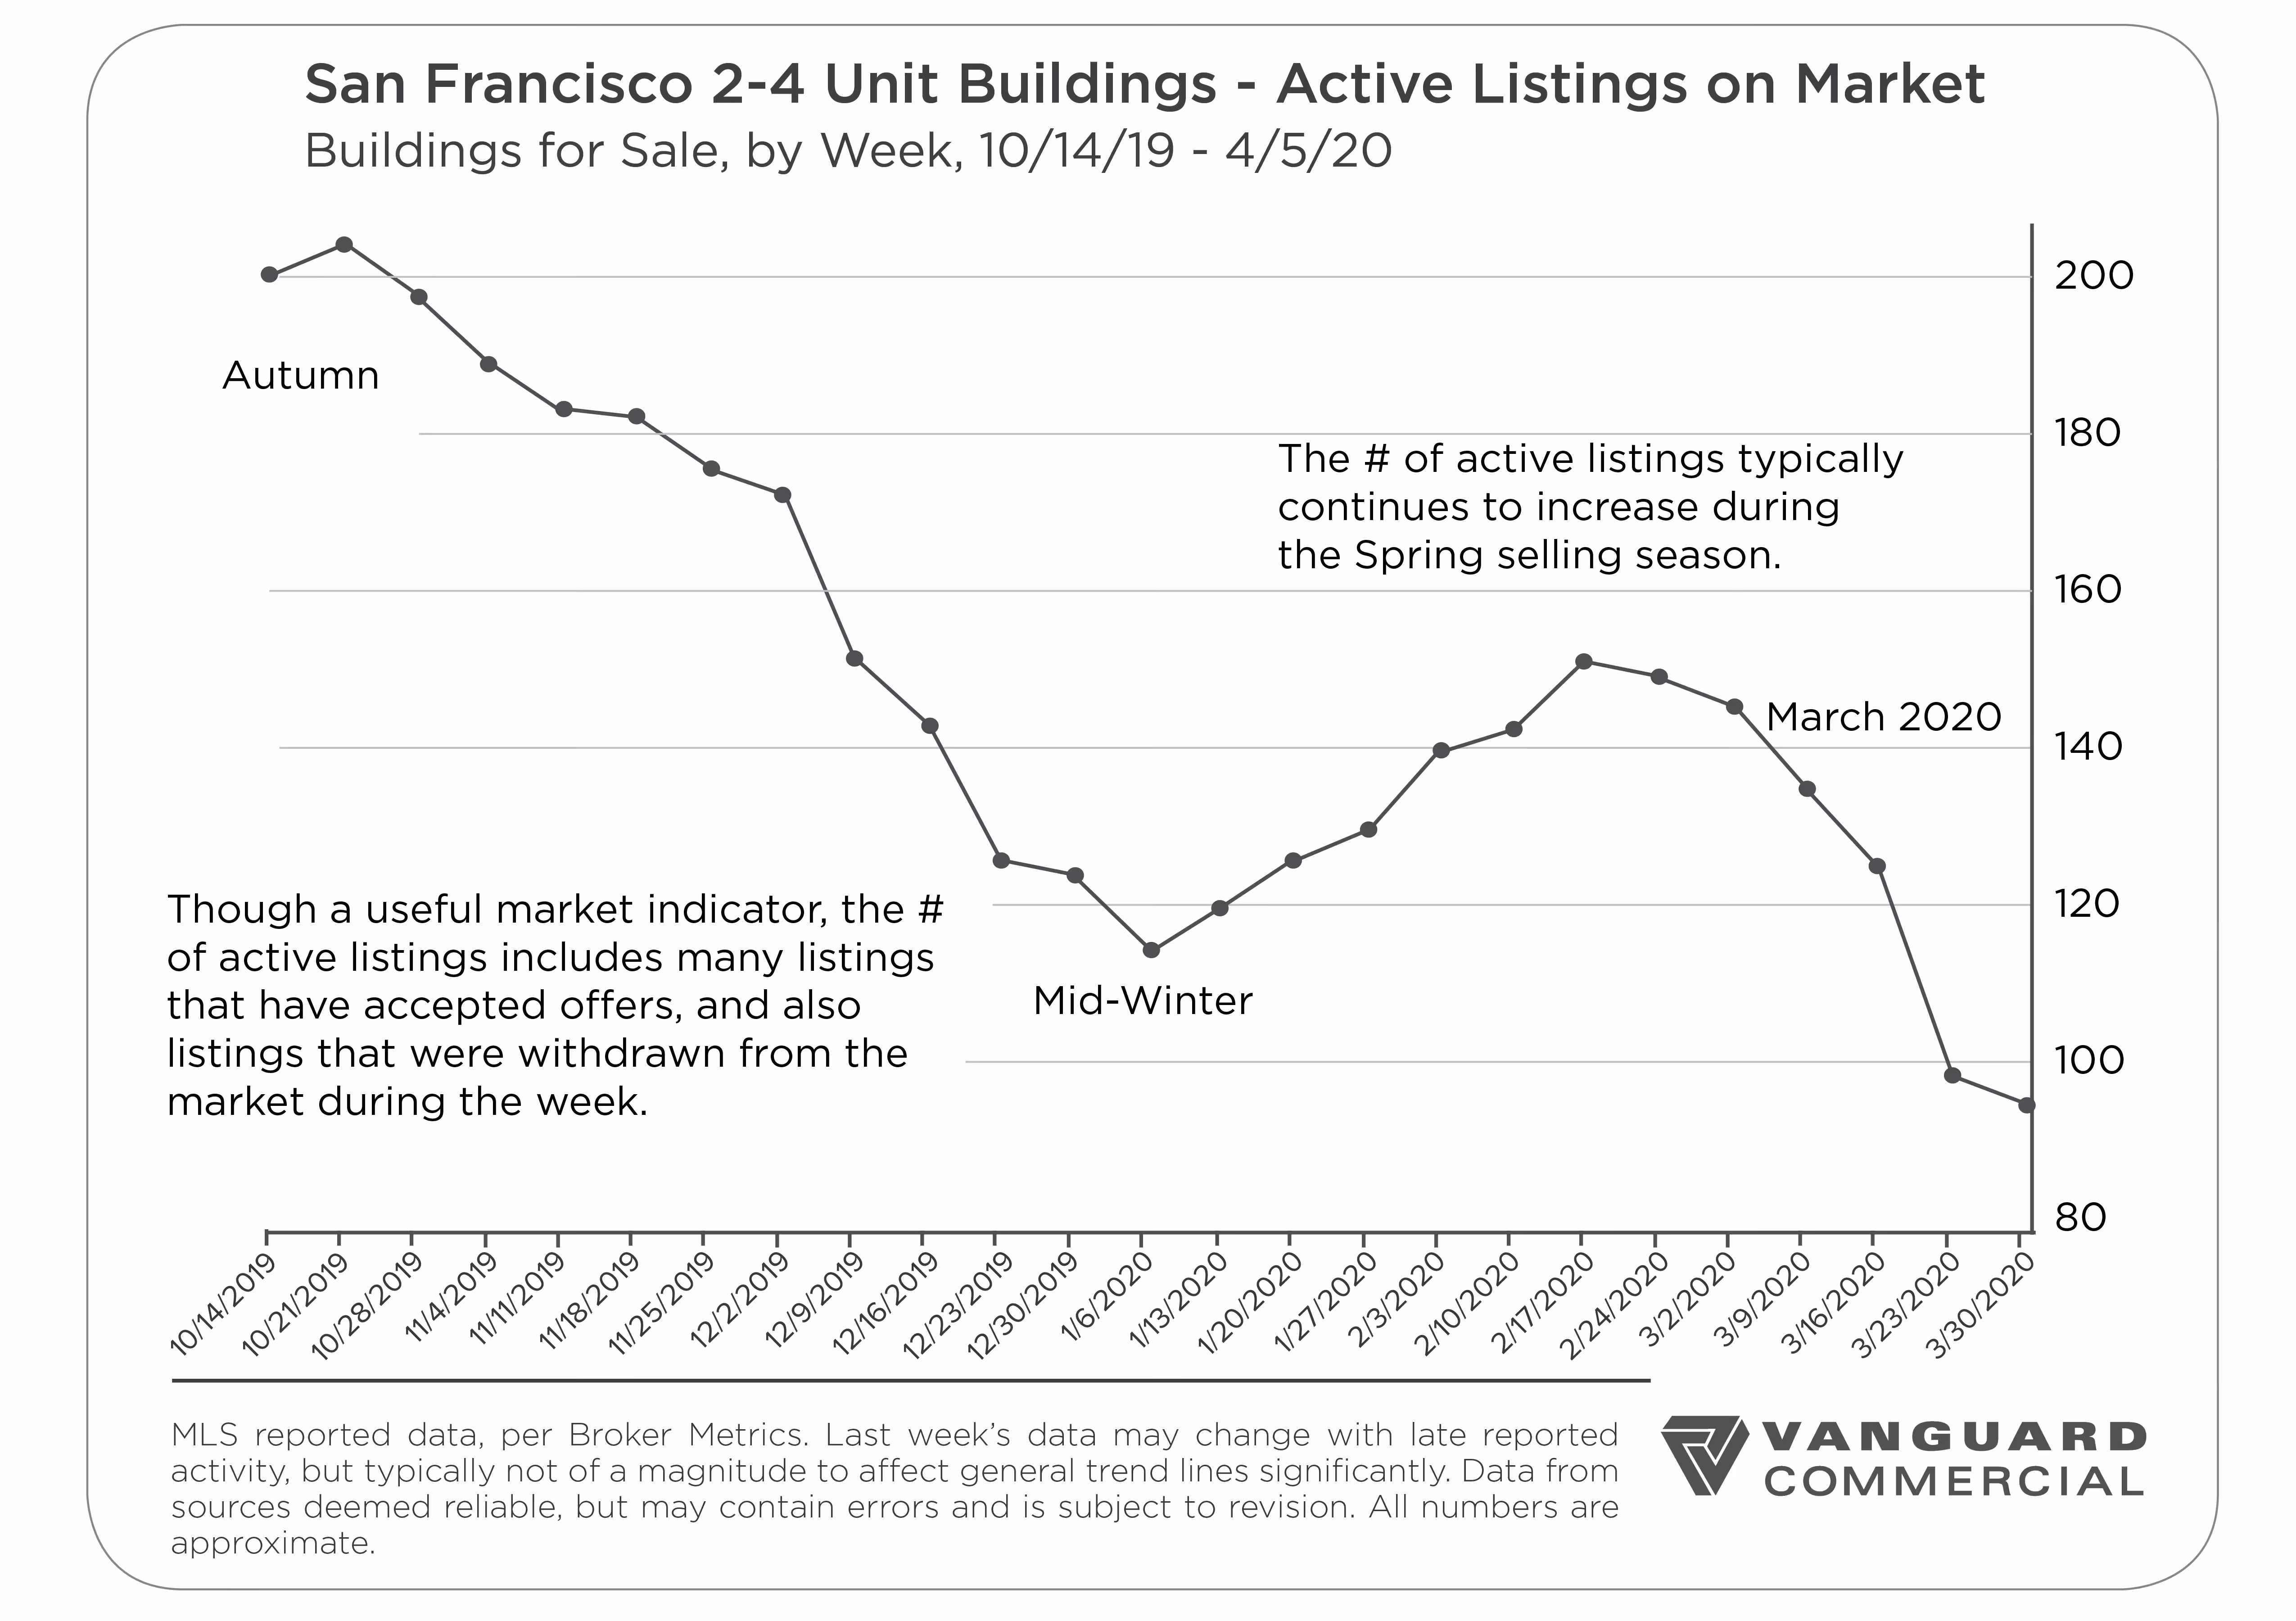
The sales data shown in the report reflects the market prior to the stay-at-home orders that were put into place as a result of coronavirus. We expect to see a more detailed overview of the effects of COVID-19 in the Q2 statistics to come.

Shrinking Inventory
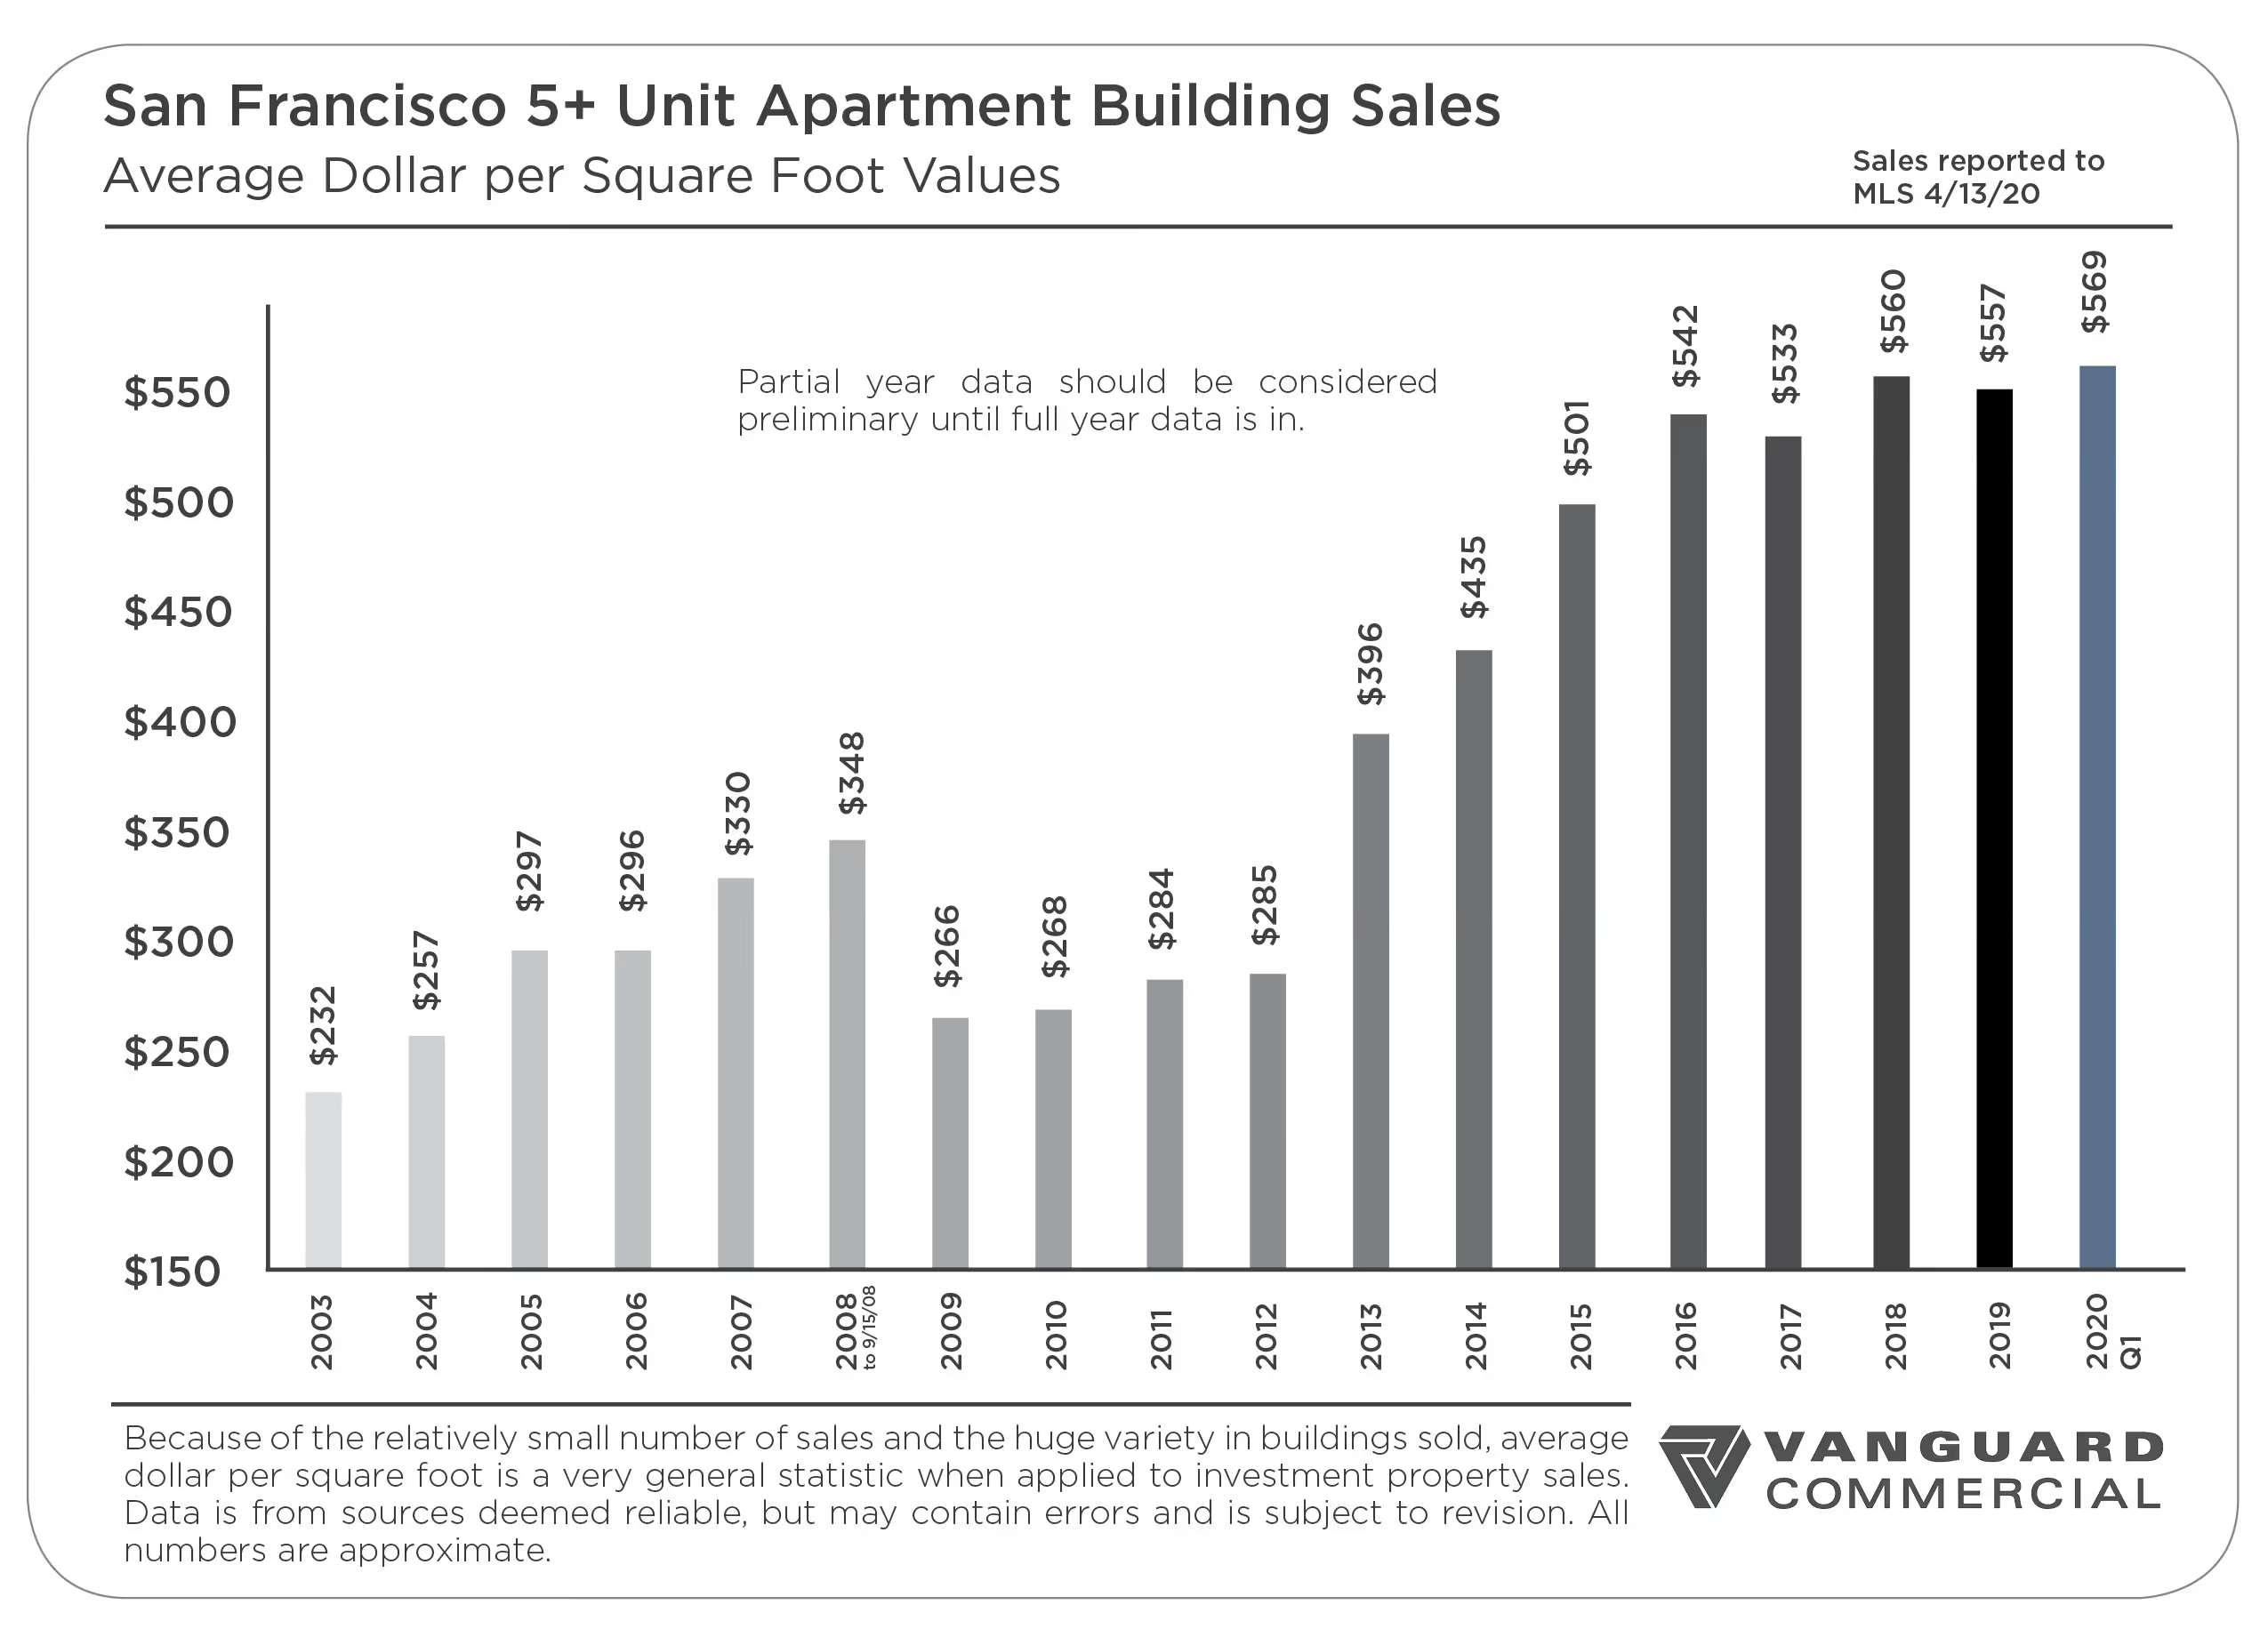
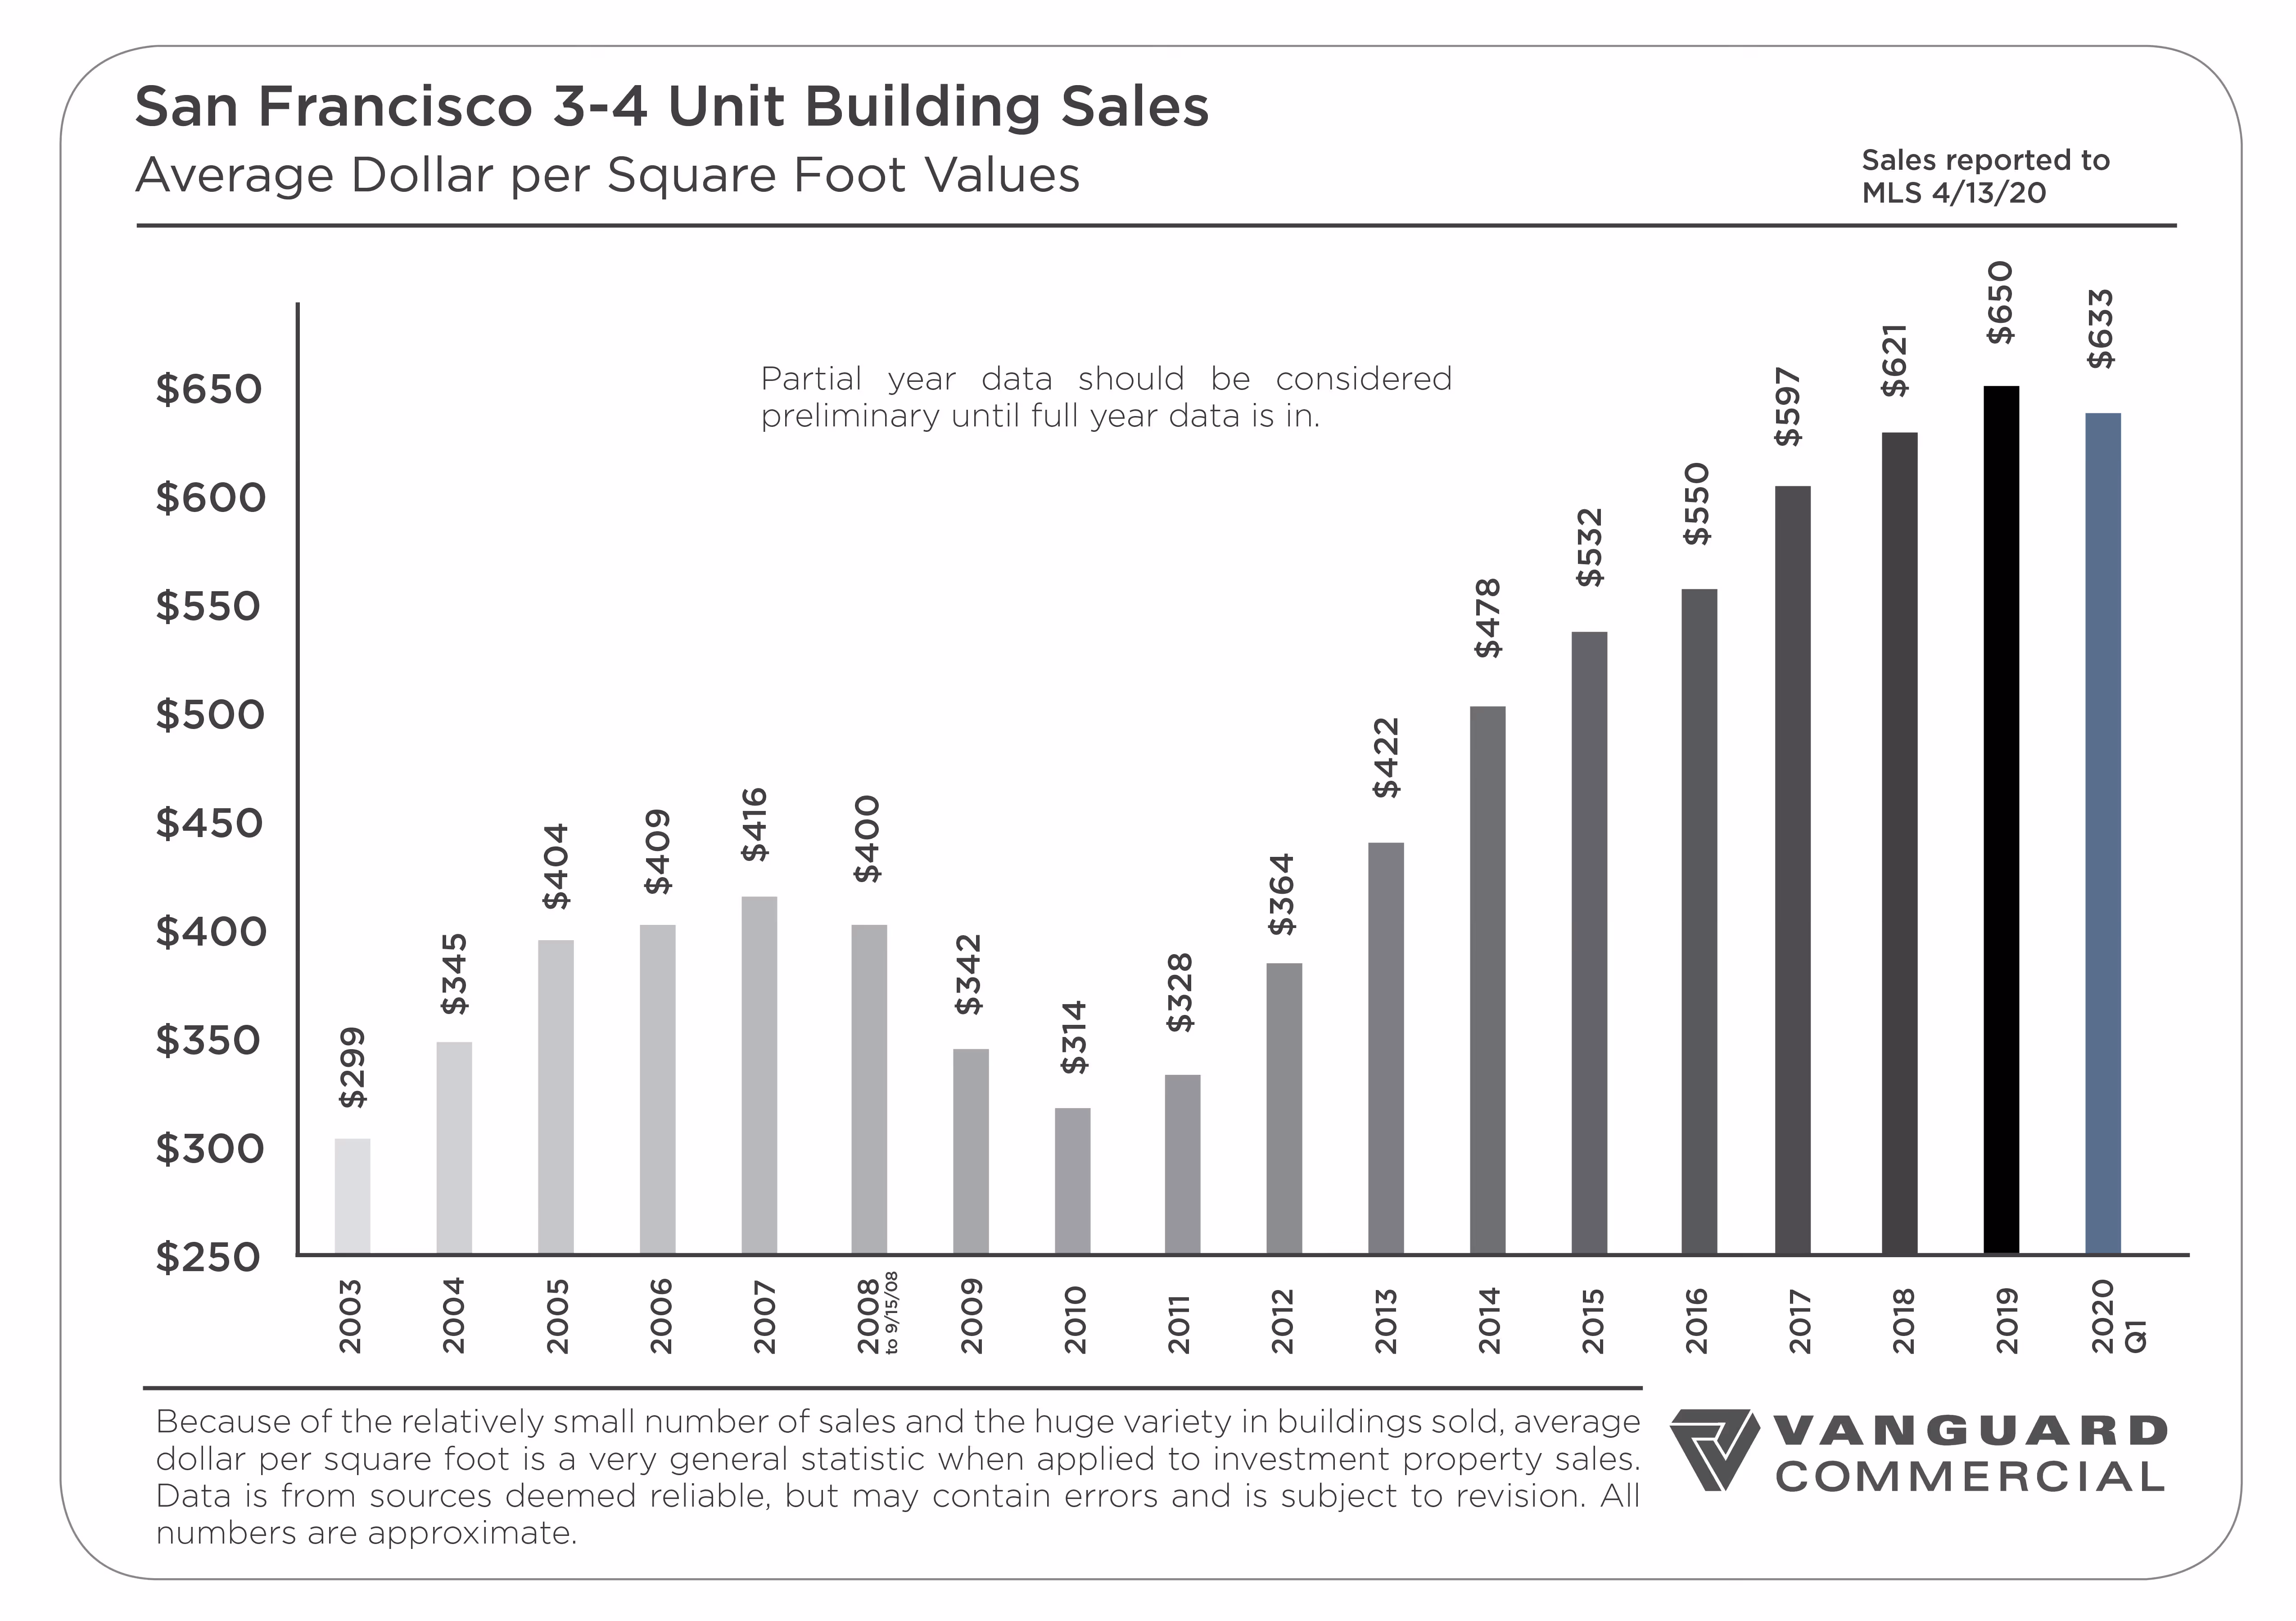
Property Values Remain Strong
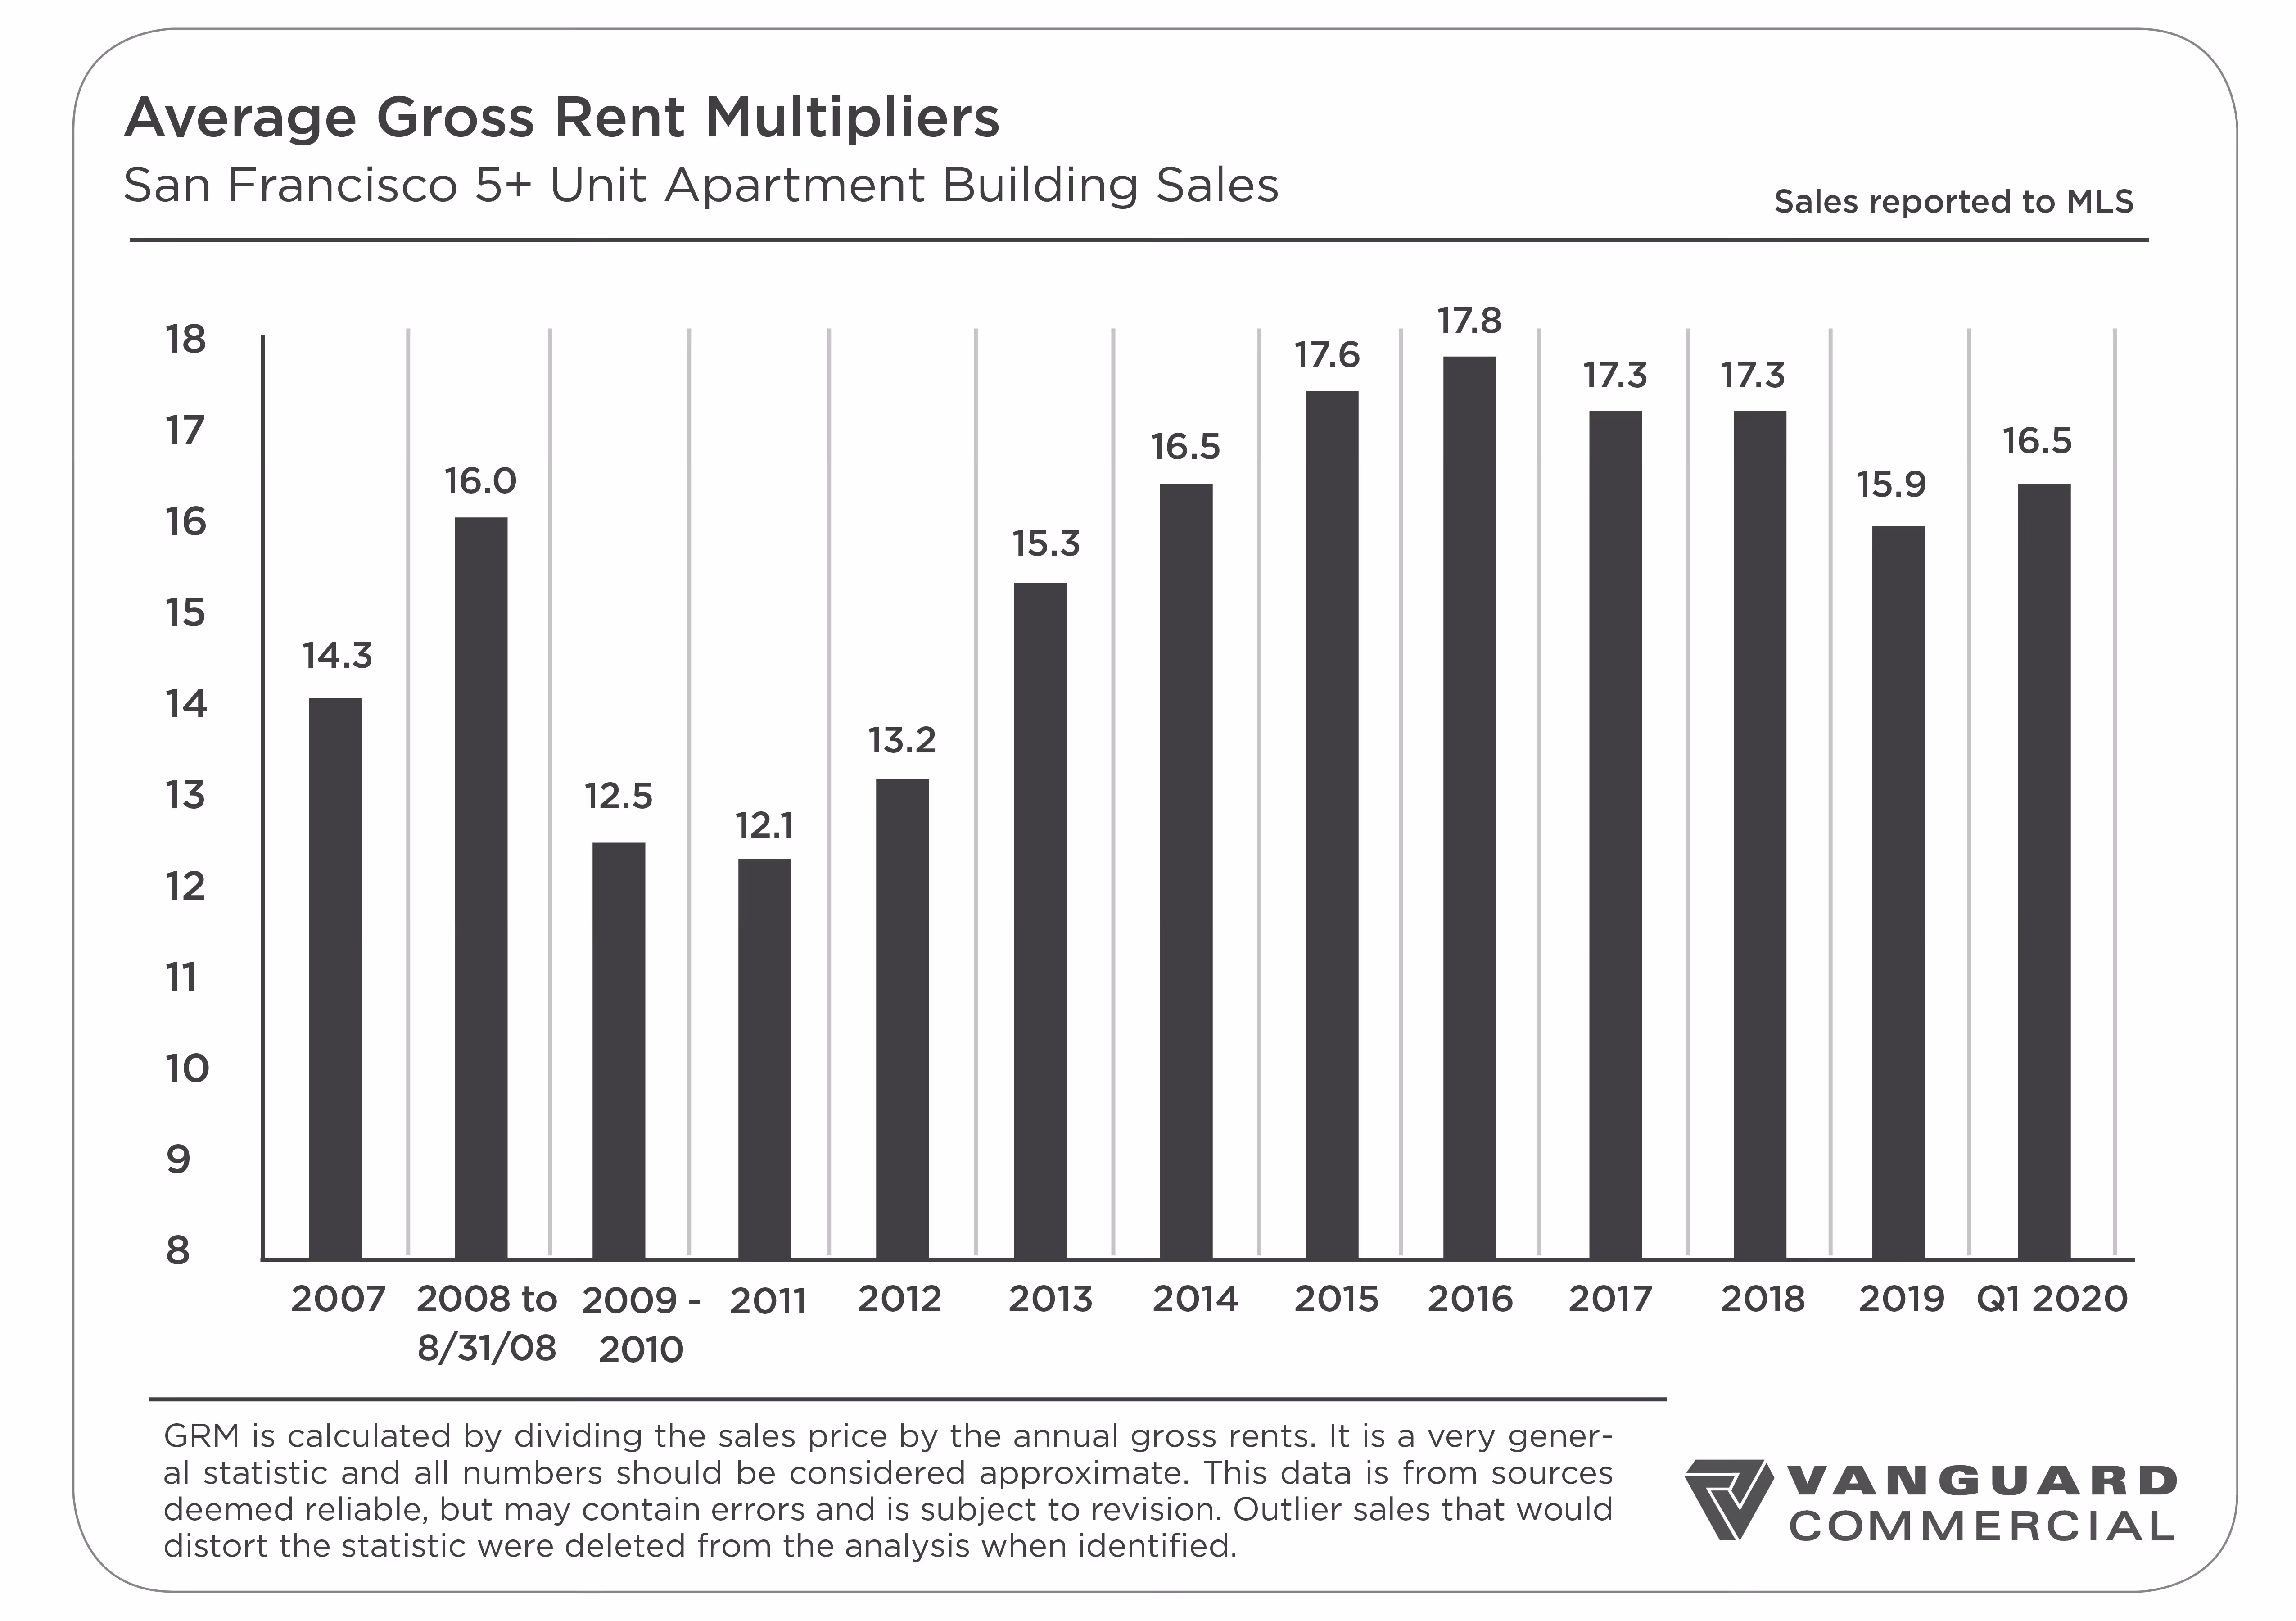
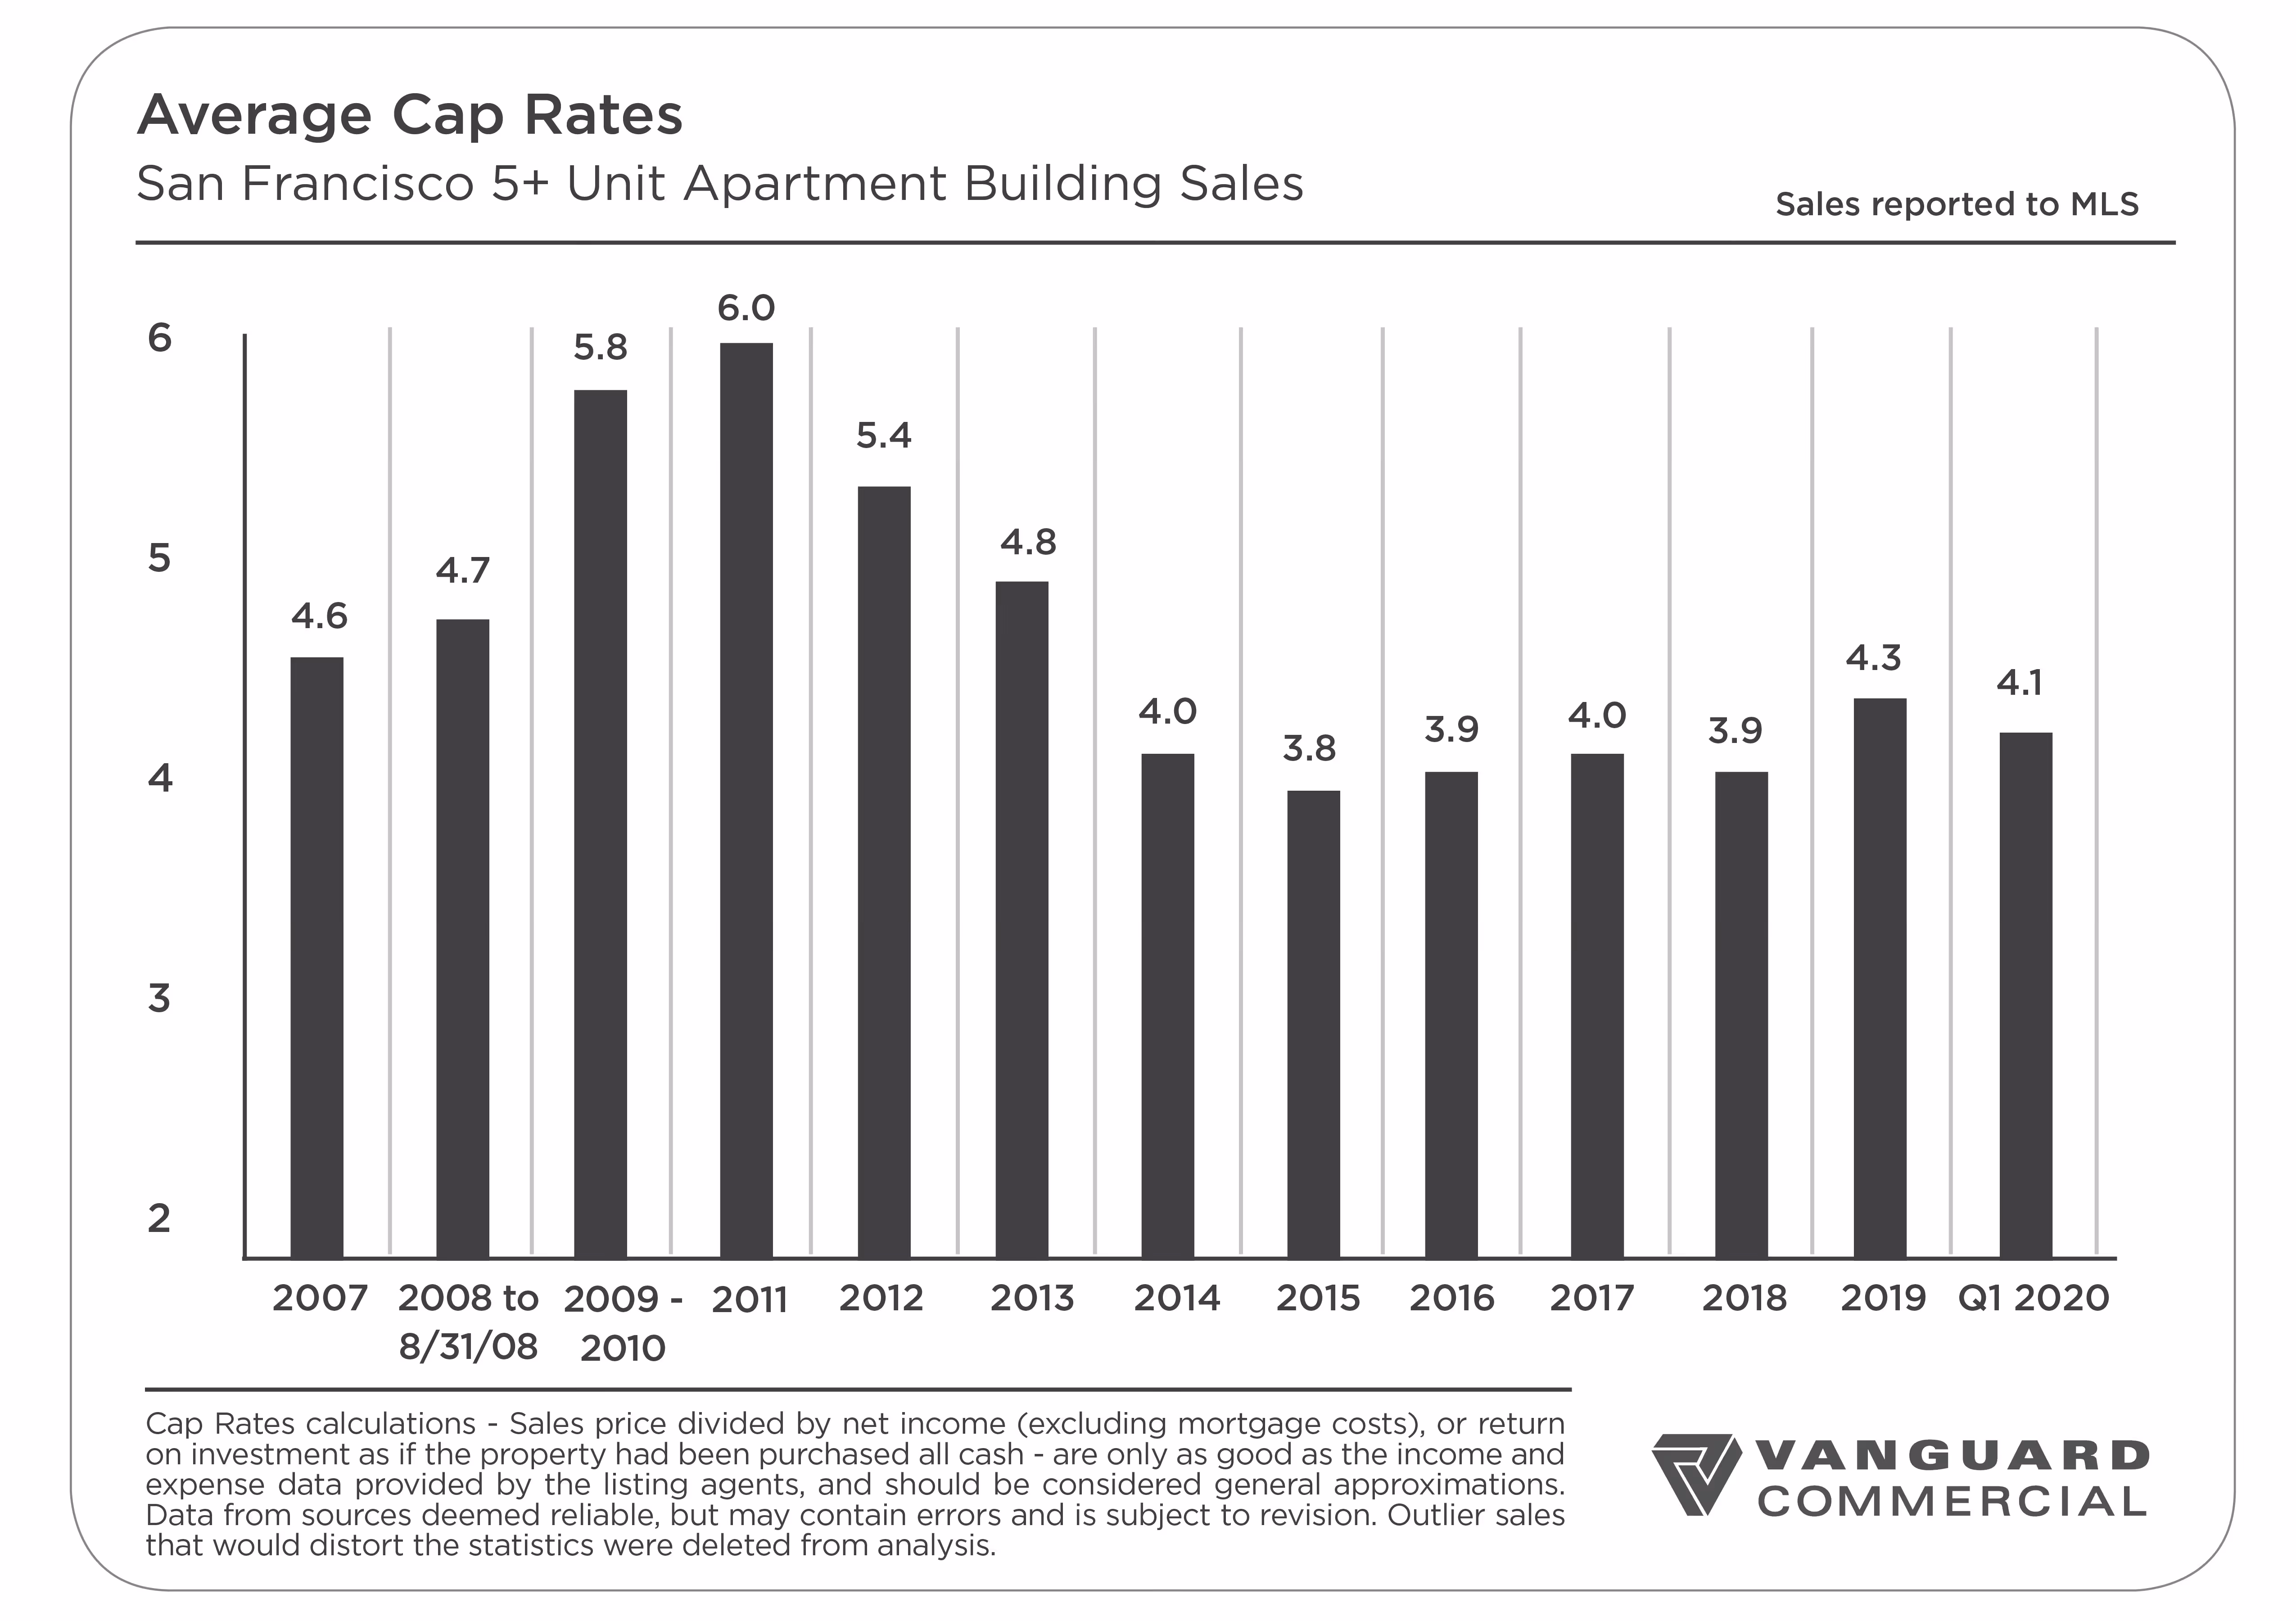
Promising Pricing Metrics: Low Cap Rates & High GRMs
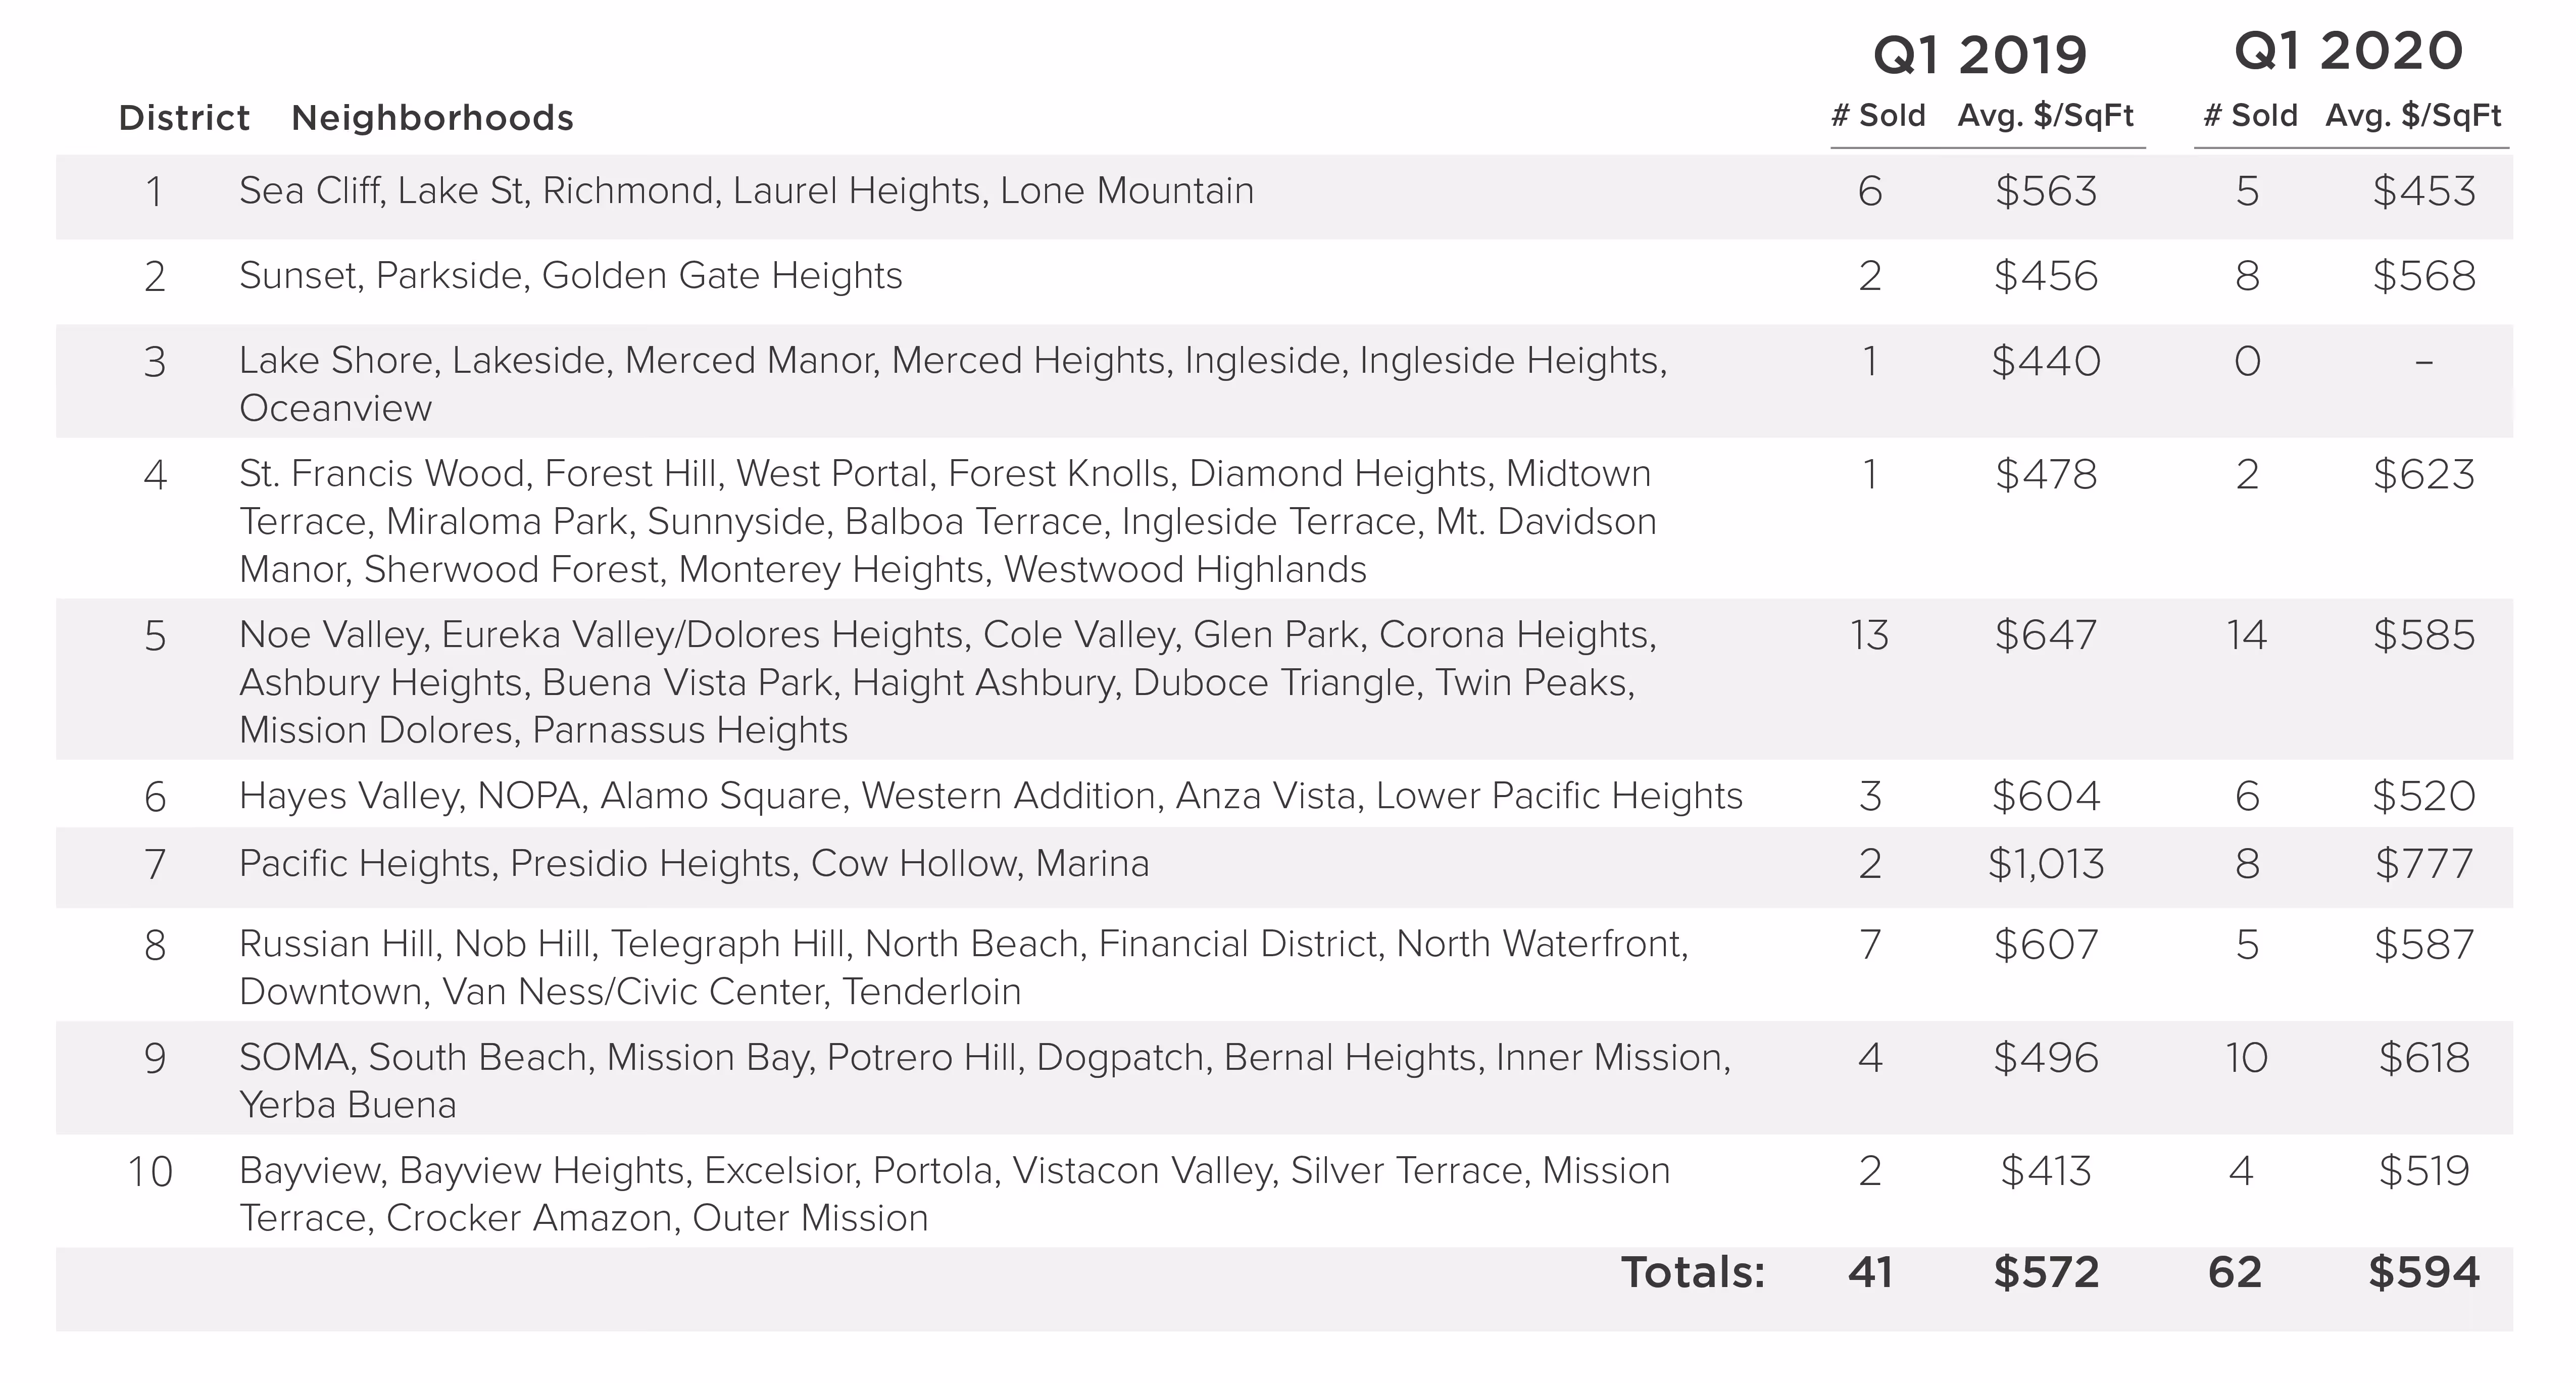
Multi-Unit Sales Per Neighborhood (3-25 Units):
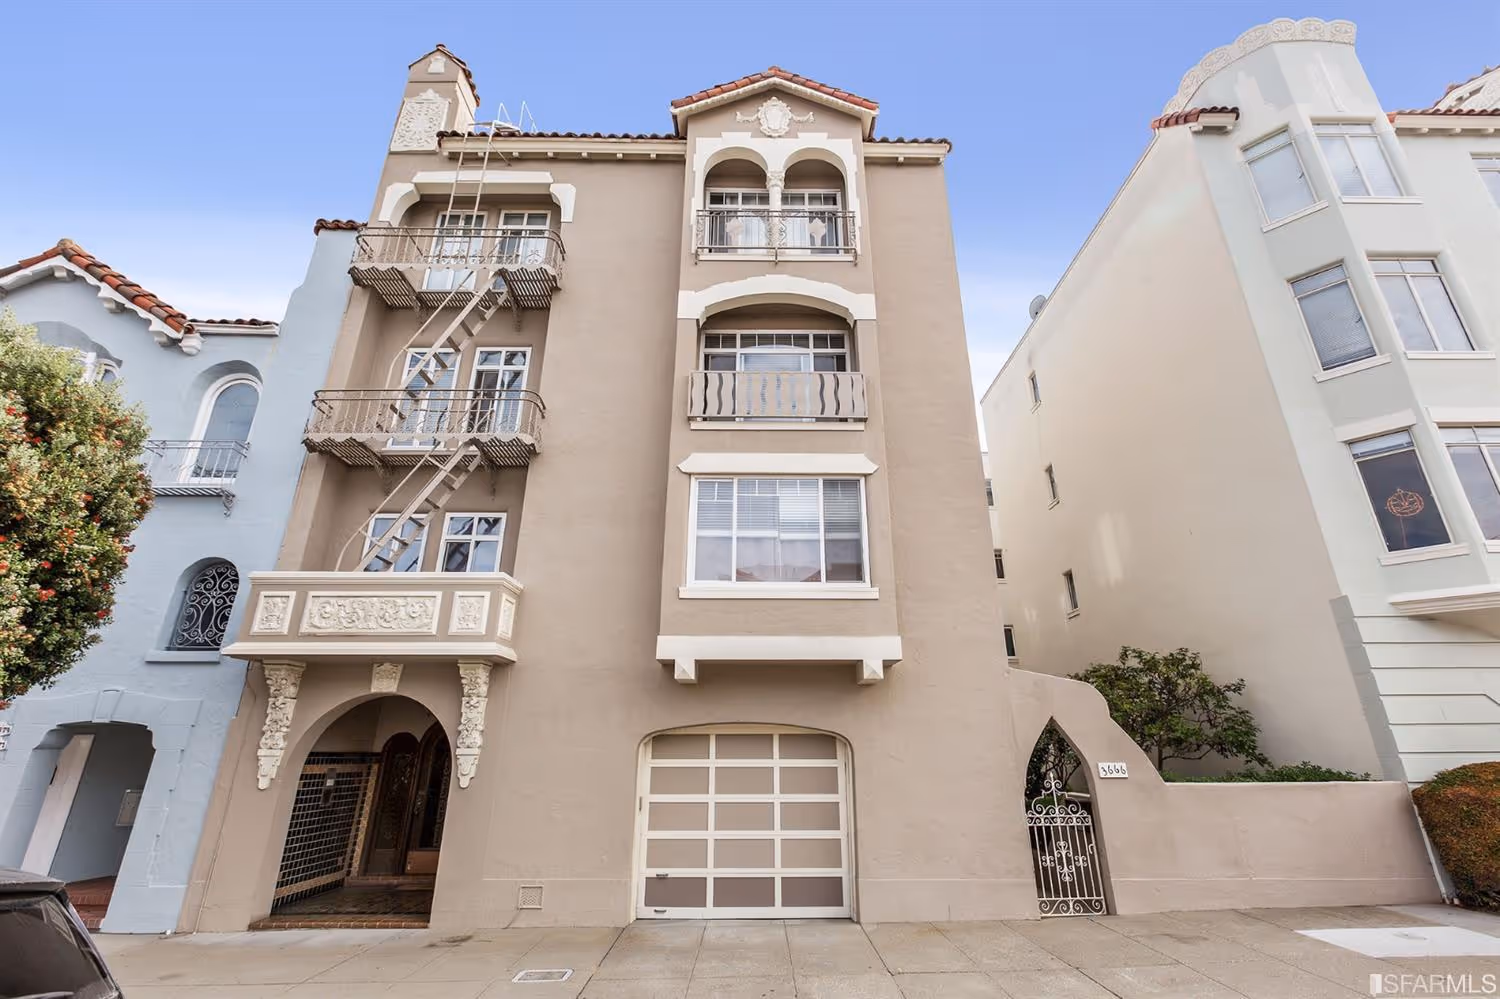
San Francisco's Most Expensive 3-4 Unit Property - Measured by Sale Price:

3 Units in Pacific Heights
$7,750,000
$975/SqFt
Cap Rate: N/A | GRM: N/A
San Francisco's Most Expensive 3-4 Unit Property - Measured by Price Per SqFt:
4 Units in the Inner Mission
$2,000,000
$1,098/SqFt
Cap Rate: N/A | GRM: 21.50
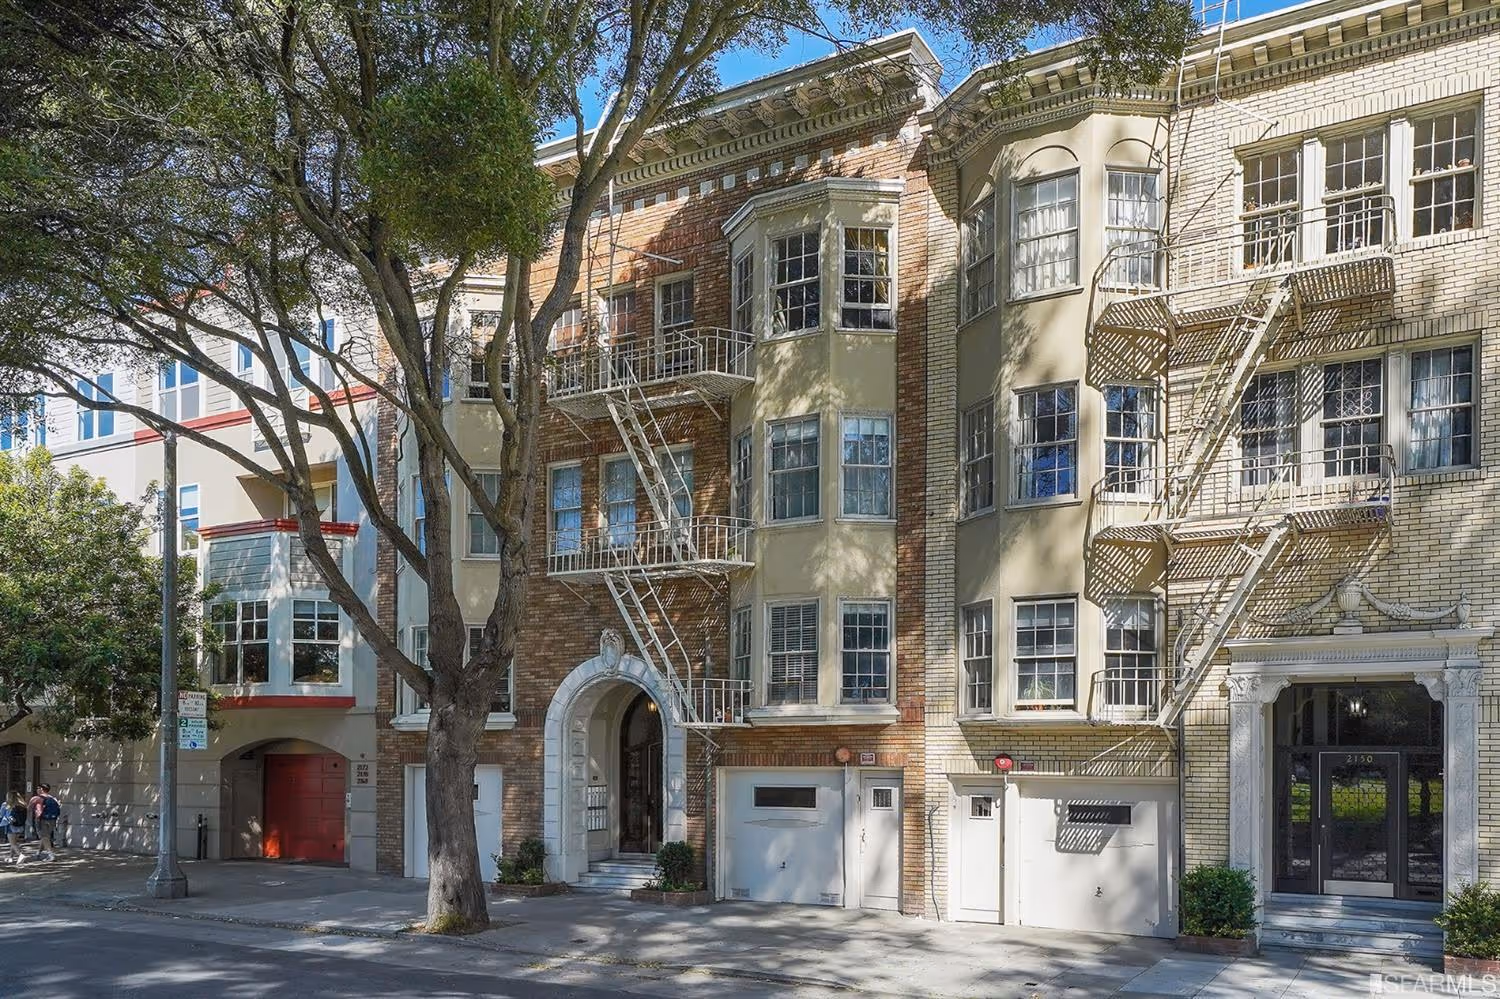
San Francisco's Most Expensive 5-9 Unit Property - Measured by Sale Price:
7 Units in the Marina
$6,500,000
$809/SqFt
Cap Rate: 2.92% | GRM: 21.62
San Francisco's Most Expensive 5-9 Unit Property - Measured by Price Per SqFt:

5 Units in Buena Vista
$3,850,000
$864/SqFt
Cap Rate: 3.19% | GRM: 20.60
San Francisco's Most Expensive 10+ Unit Property - Measured by Sale Price:
24 Units in NOPA
$7,950,000
$809/SqFt
Cap Rate: 2.91% | GRM: 18.07
San Francisco's Most Expensive 10+ Unit Property - Measured by Price Per SqFt:
24 Units in NOPA
$7,950,000
$809/SqFt
Cap Rate: 2.91% | GRM: 18.07
San Francisco's Most Expensive Mixed-Use Property - Measured by Sale Price:
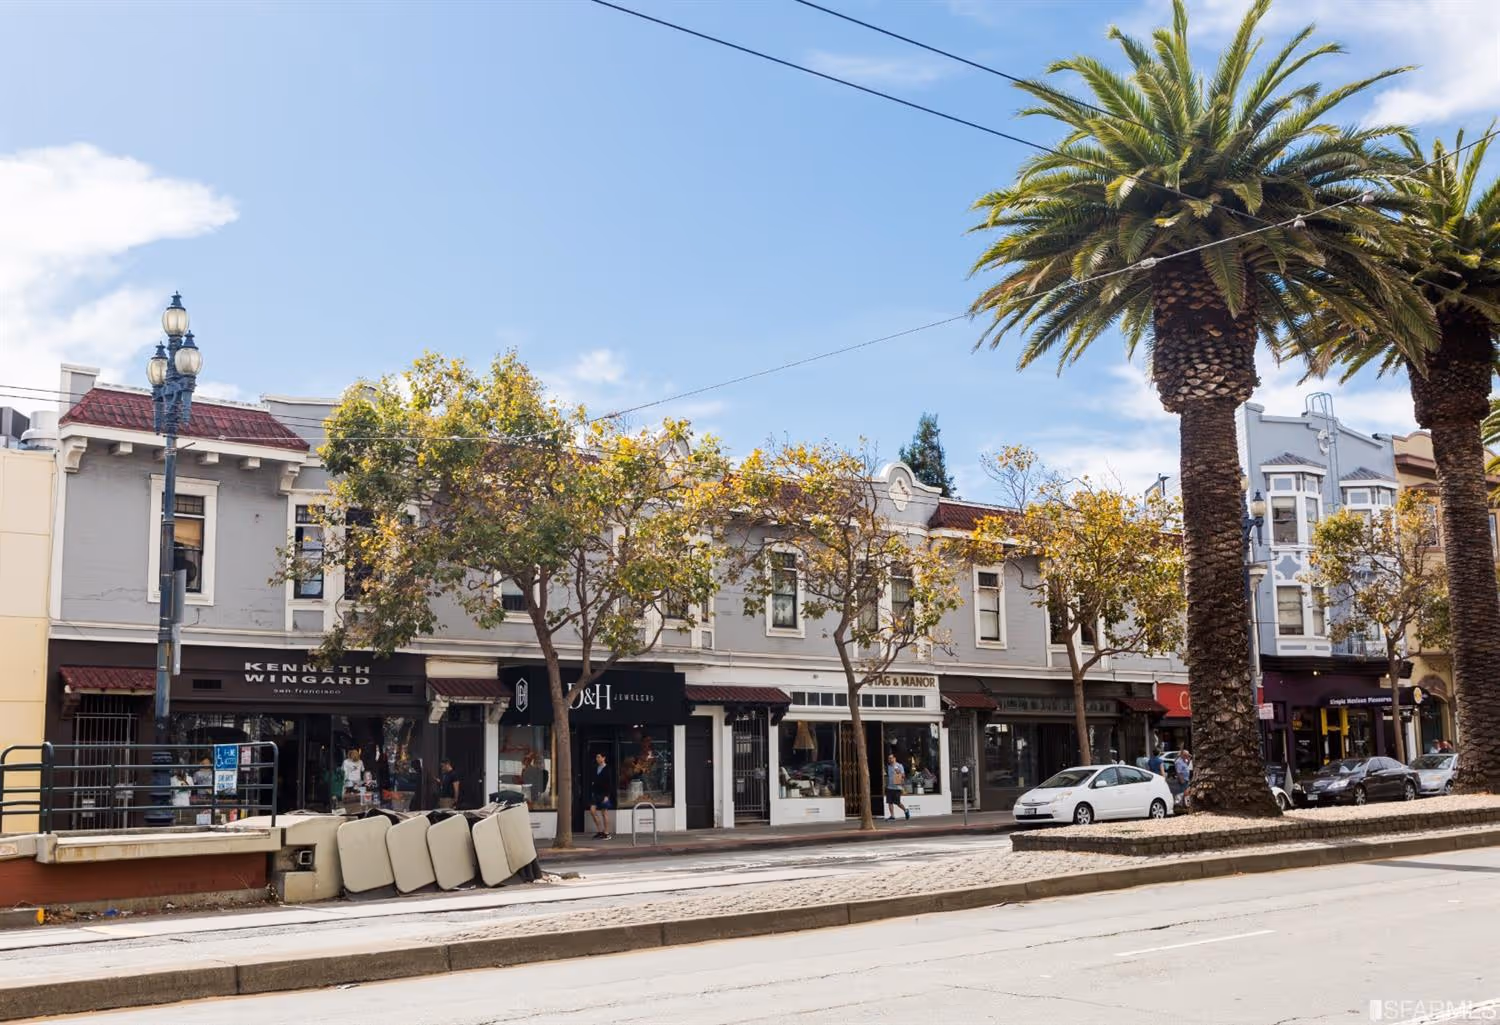
10 Unit Mixed-Use in Eureka Valley
$5,800,000
$419/SqFt
Cap Rate: 5.17% | GRM: 13.67
San Francisco's Most Expensive Mixed-Use Property - Measured by Price Per SqFt:

2 Unit Mixed-Use in North Beach
$2,050,000
$845/SqFt
Cap Rate: N/A | GRM: 16.75
